Analytics

Insights That Drive Results

Track call performance, monitor agent metrics, and understand conversation patterns. Make data-driven decisions with real-time analytics.

Analytics Dashboard

Key Metrics at a Glance

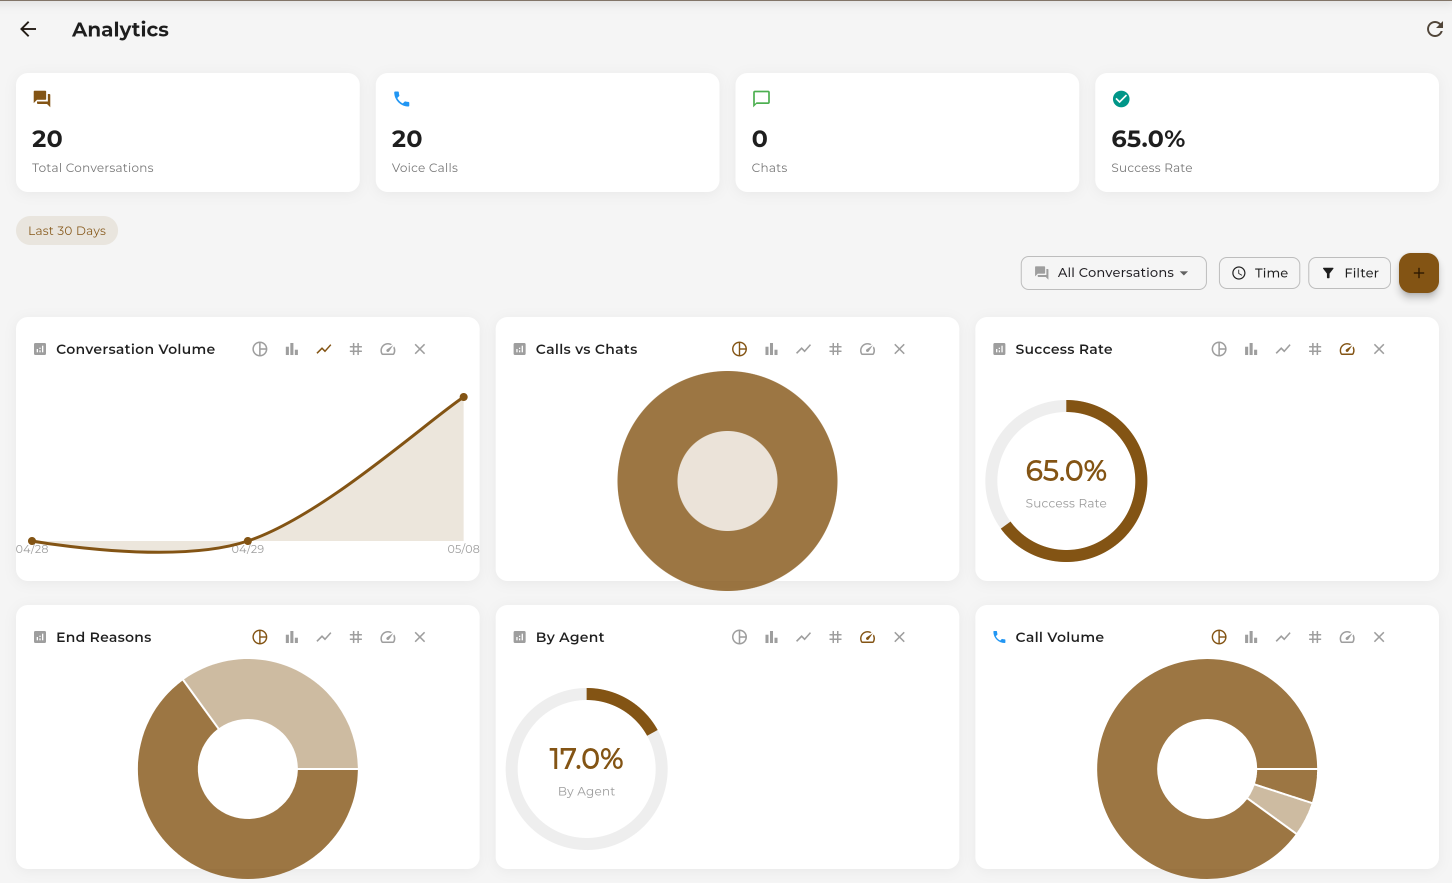
Monitor the metrics that matter most to your business in real-time.

Total Calls 12,847 +12.5% from last period
Success Rate 94.2% +3.1% from last period
Avg. Call Duration 3:42 No change
Active Agents 8 +2 from last period

Powerful Charts & Graphs

Visualize your data with interactive charts that reveal trends and patterns.

Call Volume Over Time

7d 14d 30d 90d

Track call volume trends over time. Filter by 7, 14, 30, or 90 days to identify patterns and peak periods.

Call Outcome Distribution

Completed (75%)
No Answer (15%)
Failed (5%)
Busy (5%)

See the breakdown of call outcomes at a glance.

Hourly Call Distribution

Identify peak calling hours to optimize agent scheduling.

Everything You Need to Analyze

Powerful tools to understand your AI agent performance.

Date Range Filters

Filter data by custom date ranges or quick presets (7d, 14d, 30d, 90d)

Export Reports

Download reports as CSV or PDF for sharing and offline analysis

Real-Time Updates

Data refreshes automatically so you always see the latest metrics

Agent Comparison

Compare performance across different agents side by side

Trend Analysis

Track metrics over time with trend indicators and comparisons

Advanced Filters

Filter by agent, outcome, duration, and custom attributes

What You Can Track

Comprehensive metrics to understand every aspect of your AI agent performance.

Call Metrics

  • Total calls (inbound & outbound)
  • Call success rate
  • Average call duration
  • Call volume over time
  • Peak calling hours
  • Call outcome distribution

Agent Performance

  • Calls per agent
  • Agent success rate
  • Average handling time
  • Agent comparison
  • Top performing agents
  • Agent activity timeline

Conversation Insights

  • Conversation length
  • Message count per call
  • Response time
  • Topic analysis
  • Sentiment tracking
  • Intent recognition

Business Impact

  • Cost per call
  • Credits used
  • Time saved
  • Conversion rate
  • Customer satisfaction
  • ROI tracking
Dashboard

Your Analytics Dashboard

A comprehensive view of all your metrics in one place.

Analytics Dashboard Preview
1

Quick Stats

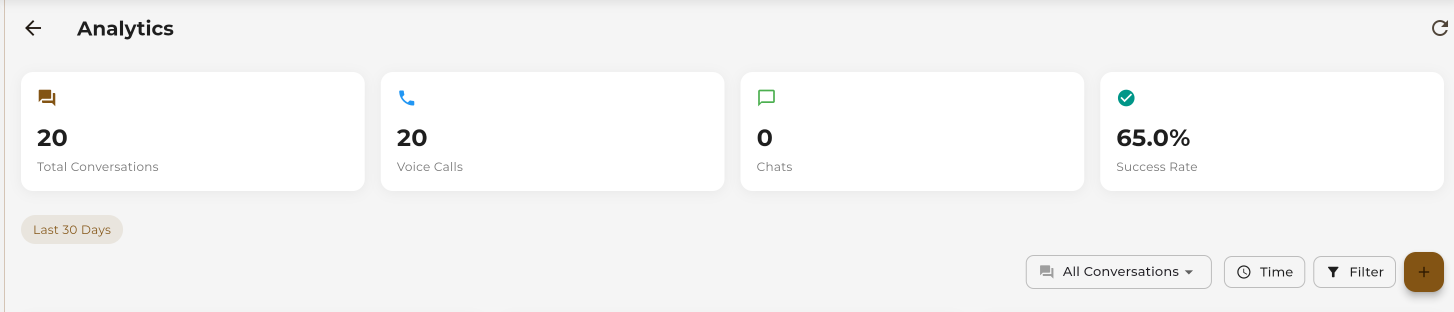
Key metrics with trend indicators at the top

2

Call Volume Chart

Interactive line chart with time filters

3

Outcome Distribution

Pie chart showing call outcomes breakdown

4

Hourly Distribution

Bar chart for peak hour analysis

Export & Share Reports

Download your data or schedule automated reports.

CSV Export

Download raw data for custom analysis in Excel, Google Sheets, or your BI tools.

PDF Reports

Generate formatted PDF reports with charts and insights for stakeholders.

Scheduled Reports

Set up automated daily, weekly, or monthly reports delivered to your inbox.

API Access

Access analytics data programmatically via our REST API for custom integrations.

Frequently Asked Questions

Analytics data is updated in real-time. As calls happen, metrics are immediately reflected in your dashboard. There's no delay between call completion and data availability.
Data retention depends on your plan. Free plans retain 30 days of history, Basic plans retain 90 days, Pro plans retain 1 year, and Enterprise plans have unlimited retention.
Yes! You can customize date ranges, select specific metrics, filter by agent, and choose which charts to include. Export your custom view as CSV or PDF.
Yes! Use our API to export data to tools like Google Analytics, Mixpanel, Amplitude, or your own data warehouse. We also support webhook notifications for real-time data streaming.
Basic analytics are included in all plans, including Free. Advanced features like scheduled reports, API access, and extended data retention are available on paid plans.